It is well known and generally accepted that in about 80% of the time, the financial markets are moving sideways. If you are a day trader then you will probably not agree, but if you take the time and zoom out to a high enough time frame you will find out that this is actually true. The financial markets just do not have it in their nature to make a new historic high or a new historic low too often. Most of the time they move up and down repeatedly, without going higher past the historic high or lower past the historic low. This is a range bound market.
1.-Spot a Trading Range Early with Price Action
First of all, in order to be able to do this you must first have knowledge
from a technical point of view of how to differentiate between a trending
market and a ranging one.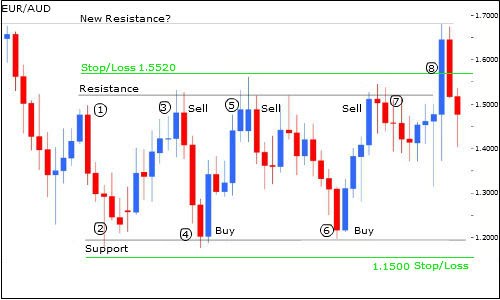

Trending versus Ranging Market
If you look at any forex pair on any timeframe you will see that when price
moves strong in one direction it makes strong impulsive moves followed
by smaller correctional moves that are pointing against the direction of
where the pair is clearly going. That is a trending market with a clear
direction and determination of the pair to go up or down. Let’s see an
example of such a trend.


As you can see, in a trending market, in this case we have a down trending pair, the trend has a clear down direction but after those impulsive moves down, it stops to take a breath and correct itself. This
generates smaller counter trend moves. After the correction phase, the trend down resumes and goes further down. This type of price movement generates swing highs and swing lows in the market. The points in the diagram above marked as LH are the lower highs or swing highs of the trend and the points marked as LL are the lower lows or swing lows of the trend. An impulsive move in the direction of the main trend is every strong move down in this chart that starts at a LH and ends at a LL. A correction move is every small counter trend move in the chart above that
starts at every LL and finishes at every LH. Let’s see the same trend again to illustrate this.

An important thing to always consider when judging a trend and trying to correctly label its highs and lows is the degree of the moves. Please notice in the example above that I have only labeled as LH and LL the price moves of roughly the same size or amplitude or degree.
Those smaller moves inside the bigger moves are not relevant to our main trend. Let me illustrate this.

In the same downtrend you can see there two small correction moves that do not qualify to be taken into consideration.
They could be relevant for a downtrend on a smaller time frame, but for this 4 hours time frame
trend they do not matter because they are of an inferior degree. There is however one exception to this rule. Small waves like the one above should be taken into consideration when labeling the trend only if the impulsive move that follows that wave is huge in length and very sharp or steep. Please look at the chart below.

Please note that all three small waves in this chart are of the same degree or size.
The difference between the first two and the last one is made by what price does after them. In the case of the first two small waves circled in orange price behaves rather normally after making them
in the sense that the impulsive moves that follow are small themselves and match their preceding waves.
These two are not to be taken into consideration when deciding on how to label the trend.
The third small wave circled in red is different because of the huge and very sharp move down that follows.
That move validates the small wave and gives it importance. As a consequence, this small wave is relevant to the main trend and should be labeled as a new pair of lower high and lower low in the downtrend above. As guidance, you should label the waves of an inferior degree like the one in the above chart if the impulsive move that follows after it is at least 4-5 times greater in length than the wave itself.
You can see if that is the case just by looking at the chart, you do not have to measure exactly the number of pips. This is the only exception that you should make with small waves when labeling your trend.
An up trending market looks the same way, the only difference being that the trend is up and, as a consequence, the big impulsive moves within the trend are pointing upwards and the correctional small moves are pointing downwards against the trend. Let me illustrate this.

In this example you can see an uptrend. Price is moving up alternating impulsive moves in the same direction as the trend with correction moves against the direction of the uptrend. The price moves marked with green lines are the impulsive moves and the red ones are the correction moves.
The small move circled with red is of an inferior degree and it should not be labeled as a HH-HL pair because it is too small when compared to the other ones to mean something for this big 4 hours time frame trend.
This is a trending market from a very technical point of view.
The trends move in waves creating highs and lows in the market. You should always label your trend’s highs and lows as this will become important when judging if a trading range is starting to develop.
Also from a technical point of view, a ranging market is one that is not behaving like in the examples above. A sideways market in characterized by the fact that price is not making new highs and lows anymore, instead it begins to make swing highs and swing lows inside the territory of the last impulsive move. Let me illustrate this.


In this example there is a clear downtrend. Price makes a wave that we label as a pair of lower high and lower low. After that second impulsive move down price fails to go below and make another pair of LH-LL. It is starting to move sideways and makes swing highs that stay below the last LH and swing lows that stay above the lowest point of the trend. This is a pair that has entered in sideways movement. Until price goes up past the last lower high or it goes down past the lowest point of the downtrend this pair will remain in sideways price activity and should be treated accordingly. Let me illustrate this clearly.

In conclusion, this is the difference technically speaking between a
trending market and a sideways market. When trending, the market
makes new highs and lows all the time, when in sideways mode, the
trend pauses and the market makes highs and lows inside the territory of
the last high and low. When you see this kind of price behavior you
should be extra careful about the trading setups your trend following
system offers you.


0 Comments