Bollinger Bands Forex Trading Strategy  With 20 Period Moving Average
The bollinger bands forex trading strategy with 20 period moving average is a very simple forex strategy that works very well for all kind of forex traders.

Learn below how to setup and trade this strategy in under 10 minutes.  
REGISTER IN: ETORO
Let’s get started with the trade setup...

Trade Setup: 

Timeframes: 5 min and above

Currency Pair: Any

Trading Indicator: Bollinger Band with settings set to 20 periods.

Here’s how to set up the settings in MT4 trading platform: 
SOME THINGS YOU NEED TO KNOW ABOUT THE BOLLINGER BAND INDICATOR

Before we get into the rules of the bollinger bands forex trading strategy here are some things that you need to know:

1.     if price is moving below the 20 period (the middle line) then the market is in a downtrend.
2.     if price is moving above the 20 period, then the market is in an uptrend.
3.     price has to come and touch the middle bollinger band  line (the 20 period) for any trade to be initiated.
4.     the upper bollinger band line or the lower bollinger band lines can be used for take profit (as soon as price touches it, exit…this is one option for taking profit on your trades) 
THE TRADING RULES OF THE BOLLINGER BANDS FOREX TRADING
STRATEGY WITH 20 PERIOD

Selling Rules:

Check if market is in a downtrend and then price rises up to touch the middle bollinger band line.

When middle line is touched, place a sell stop pending order about 3-5 pips under the low of the candlestick that touched it.

Or you can wait to see if a bearish reversal candlestick is formed first before you place your sell stop pending order.

The sell stop pending order must be placed only after this candlestick closes.

Place your stop loss anywhere from 5-10 pips (or more) above the high of the candlestick.

When to take profit or exit a trade- a few options you can use:

When price goes back down and touches the lower bollinger band line (you exit your sell (short) trade). 
Or set your take profit level equal to the distance the price traveled in pips during that upswing to touch the middle bollinger band line (see the blue dotted line below in the chart). 

So you use that difference in pip movement and calculate at what price level below you need to place your take profit target.

Or you can also use the previous swing low (bottom) as your take profit target level.

I hope this chart here makes things a little bit more clearer for you: 

Buying Rules:

The rules for buying are completely opposite to the selling rules given above. 
You just do the exact opposite: 
Short-term and long-term trend strategy 90% of successes
This negotiation strategy will teach you how to detect new trends
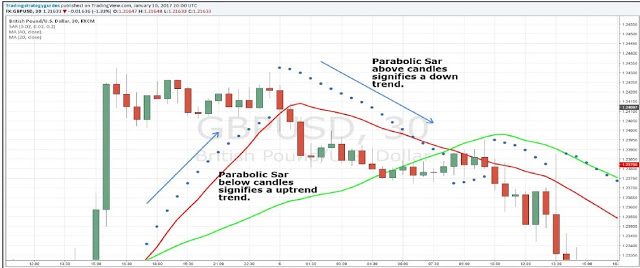
The Parabolic Sar Negotiation tool is a dynamic trading tool that is used by many professional traders in each market (Forex, Stocks, options, futures). It is best used when the market is in trend. If the market is choppy, the market moves sideways, this tool

This was developed by Welles Wilder when he introduced this in his book in 1978 which was titled, "New Concepts in the systems of technical commerce".
What basically does this tool is to help traders determine when the current trend will end or about to end. The way it shows you this is by the points that appear above or below the price candle. appear above or below the current sail for a specific reason. If the point is above the sail will be a sales signal or downward trend. However, if the point is under the candle, this may be a sign to buy or a bullish trend. When the change occurs (the point goes from bottom to top the next candle) This indicates that it may be starting a potential reversal.
Some may think why they don't exchange the dots. When you invest, just make an entry at that price. Technically you can trade like that and win some, but this is a very risky way to trade with this. You need other tools to validate this potential trend reversal.


As you can see above, if you just change the dots, this will happen frequently. That's why we use this indicator and two moving stockings to determine an entry point. Moving Stockings will help verify that a reversal is actually occurring. The combination of these indicators will give you precise trend reversal adjustments. This strategy can be used in any time period in your table. So traders of the day, traders swing and resellers are welcome to use this kind of strategy. Here are the indicators you need to apply in your chart to use this business strategy:
1. Parabolic Sar: Standard configuration
2. Moving Average length 40 = green color in our example
3.20-Length Moving average = red color in our example
Rules for short operations using this strategy
This strategy is tested with different pairs with a 90% effectiveness
To see more details and rules that we will have to respect please download the Archibo that I share.
How to make money with small trading accounts?

Unless you have a lot of money and you don't mind bursting accounts of €500 every 2 by 3, earning significant money with small bills requires risking everything. Do not try to convince you otherwise, you must be aware that with a trading account "media" of €5,000 does not earn much money, even if you do very well, you have to grow in the long term and have patience. Taking 50% a year would not give you for a salary and that 50% (professionally speaking) is something extraordinary.

If you have enough money you can risk 100% to try to win it in the short term, but if your intention is to dedicate to this starting with €200 you have very black, although the broker tells you otherwise ... he incites you because he knows that you will lose it sooner or later.
And how do I earn money with a small trading account?
There are many ways, but you know by logic that to make a lot of money you need an account with great capital.

If you have €500, the sensible thing is to manage it with head, not risk more than 1% per operation and be true to your trading system, I know that 1% is a misery, both loss and profit but we should focus on the%. For an investor the% is what interests, no matter if it leaves €500 or 20 million, he wants that% for him and you can offer.

Your goal to live from trading, make money, etc. It is not converting €500 into millions, it has no logic, is to create with them a portfolio that attracts investors, leverage your results through the capital to "buy" your strategy and achieve that goal little by little. It's coherent, isn't it?, believe me that that very possible and realistic, the other is to be a real "delusional".
In addition, a professional investor who cares for his capital, does not seek extraordinary returns, before them runs away, knows that this is a clock pump. The good investor looks for coherent returns in relation to the average that moves in this type of products, if in the end you give more ... much better. You just have to go through the results of the best investment funds, the average annual round 15%
These are the steps to access the possibility of living trading with €500


Logically you need to be "good" operating, be consistent in your results and use appropriate risk management. Also tell you that the goal can be in making this process to win that big capital and then be independent or grow exponentially the capital that buys your strategy.

IQOPTION allows you to start the path to the goal, you can see the "traders" who are getting through their darwins (strategy that buys the investor) a great capital and the revenue they are getting.
Open an account here and opera as you know, in less than 2 months you will have your Darwin active in order to capture those investors.
With a good result you can access the awards "Darwinia", offer capital to manage the 40 top of the ranking, the first receives €300,000!!
As you see, even without getting investors, you can get a great capital to leverage your benefits if you stay in good standing in the Darwinia contest.

The trader can be an investor

Although we as traders want to operate, there is an additional way to achieve returns. Building your own Darwins portfolio, there is already a movement of people who classify them and offers such information. A good trader must recognize the work of other peers, support them and even invest in them. In next articles will be offered that information and see which we can add to our portfolio.

We will soon update the information of our darwins and follow up with our daily operations.

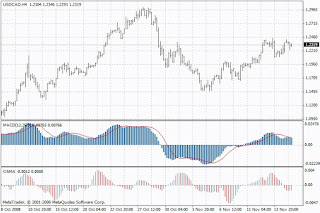
Moving Average Convergence Divergence, MACD-indicator for MetaTrader 4
The moving average of convergence divergence (moving average Convergence Divergence, MACD) is the next dynamic indicator of trends. Indicates the correlation between two mobile averages of the price.
Download here

Moving average convergence divergence, MACD

The technical indicator of moving average convergence divergence is the difference between two periods of 26 and 12 of an exponential mobile average (EMA). In order to clearly show the buying and selling opportunities, a signal line called (Period 9 moving average indicator) is plotted on the MACD graph.

The MACD is more effective in commercial markets that oscillate. There are three popular ways to use the mobile convergence/divergence average: crosses, overbought/oversold conditions and divergences.

Crosses
MACD's basic trading rule is to sell when the MACD falls below its signal line. Similarly, a purchase signal occurs when the mobile convergence/divergence average rises above its signal line. It is also popular to buy or sell when the MACD is above/below zero.

Overbought/Oversold status
The MACD is also useful as an overbought/oversold indicator. When the shorter moving average moves considerably away from the longer moving average (i.e. the MACD rises), the price is likely to be spreading too far and will soon return to more realistic levels.
Divergence
An indication that approaches the end of the current trend an end to the current trend takes place when the MACD diverges of the security. A upward divergence occurs when the convergence/divergence moving average indicator is making new peaks while prices do not reach new peaks. A bearish divergence occurs when the MACD is making new lows, while prices do not reach new lows. These divergences are more significant when they occur in relative overbought/oversold levels.

Calculation of the MACD
The MACD is calculated by subtracting the value of an exponential moving average of 26 periods of an exponential moving average of 12 periods. A simple moving average of 9 dotted periods of MACD (the signal line) is then plotted on the MACD.

MACD = EMA (Close, 12)-EMA (Close, 26)

SIGNAL = SMA (MACD, 9)

where:
EMA — exponential moving average;
SMA — Simple moving average;
Signal — indicator signal line.

Ichimoku Kinko Hyo - Indicator for MetaTrader 4

The Ichimoku Kinko Hyo indicator has been predefined to characterize the market trend, support and resistance levels, and to generate buying and selling signals. This indicator works best in weekly and daily charts.

By defining the dimension of the parameters, four time intervals of different lengths are used. The values of the individual lines that compose this indicator are based on these intervals:

Tenkan-sen Displays the average price value during the first time interval defined as the sum of the maximum and minimum within this time, divided by two;

Kijun-sen Displays the average price value during the second time interval;

Senkou Span A shows half the distance between two previous lines moved forward by the value of the second period of time;

Senkou Span B Displays the average price value during the third time interval offset forward by the value of the second period of time.

Chikou Span Displays the closing price of the current sail displaced backwards by the value of the second period of time. The distance between the Senkou lines is streaked in another color and is called "cloud". If the price is between these lines, the market should be regarded as non-trend, and then the margins of the cloud form the levels of support and resistance.

If the price is above the cloud, its top line forms the first level of support, and the second line of the second level of support;

If the price is below the cloud, the lower line forms the first level of resistance, and a higher the second level;

If the Chikou Span line runs the price chart in the bottom-up direction it is a sign of purchase. If the Chikou Span line runs the price chart in the top-down direction is the sales signal.

Kijun-Sen is used as an indicator of market movement. If the price is higher than this indicator, prices will probably continue to increase. When the price goes through this line the change in future trend is possible.
Another type of use Kijun-sen is to give signals. The purchase signal is generated when the Tenkan-sen line crosses the Kijun-sen in the bottom-up direction. The top-down direction is the signal to sell.

Tenkan-Sen is used as a market trend indicator. If this line increases or decreases, there is a trend. When it goes horizontal, it means the market has entered the channel.

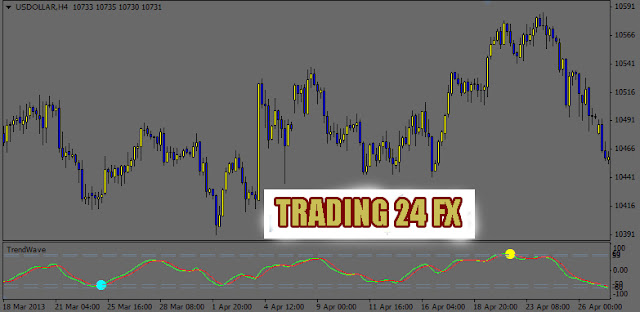
Wave trend indicator

The best trend indicator that you can find for metatrader 4 prepared and tested with barium brokers like ETORO - IQOPTION - XM and others inside the archibo you can find the indicator and instructions.
You want to be profitable in the Forex Market uses the best indicators with a high percentage of precision.
To do Trading Online and trinfar in future futures, binary options and more you will have to use our indicators tested and used by professional trading

Fundamentals: Sales of Existing Homes

These fundamentals greatly influence the economic factor of each country, and is very often followed by brokers to make a decision when investing.
Some of the masters in trading and even have formed strategies to circumvent these values with quite success.
Currency strategies with fundamentals are well known and appreciated for their effectiveness.
But if you are starting in the world of currencies, stocks or futures you will have to study these factors a lot in order to apply it with good results
Definition: This report measures the level of sales of pre-owned homes. This is considered a good indicator of activity in the housing sector.


Utility: This gives not only a measure of the housing demand, but the economic impulse. People must be financially secure to buy a home.

Source: The National Association of Real Estate Agents.

Availability: On the 25th of the month (or the first following business day) at 10:00 am ET. Data are for the previous month.

Frequency: Monthly

Review: Data are reviewed monthly for the previous month. This review may be subject to substantial changes. There was also an annual review of the previous three years. An important reference is made every 10 years.

Profitable strategy for MT4
In this blog all the indicators, the system and the robot is the best because it has passed the selection before the post of charge of the administrator.
Make sure the copy indicator or robot is in the correct folder on MT4 to work perfectly. Continue to support this blog by clicking on the ads to continue providing the best strategy and the robot.
This indicator has a high effectiveness index with a profitability of 90% effectiveness.
The check of this indicator was a week with the broker of ETORO XM BROKER.
Real account check (real money). I recommend practicing it in demo to take confidence if you are not doing ONLINE trading I recommend the best brokers mentioned above, also you can leave us in the comments, if you want to recommend a reliable and safe broker.