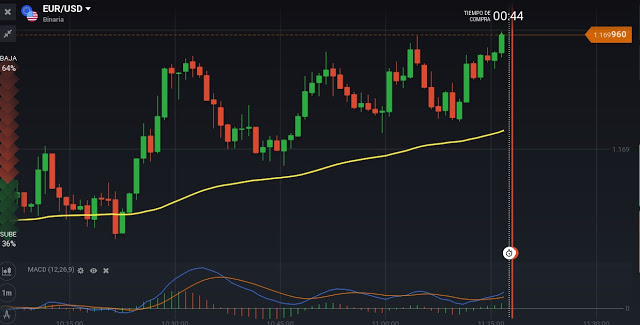
This indicator is one of the most used by professional trader to form highly profitable strategies.
RECOMMENDED BROKERS
The Convergence-Divergence moving average, or simply the MACD is a momentum indicator trend following. Describe the difference between two exponential moving averages (EMA).
Basically, convergence occurs when the two move closer EMA as the difference between them becomes smaller, while the divergence occurs when you are separating because the difference between the EMA is increasing. The MACD has three basic parts.
1. The zero line serves as the midline or neutral line between the rising areas (upper) and downward (lower) MACD.
2. The histogram represents the distance between the slow and fast EMA 26 and EMA 12 EMA, respectively. It shows the degree of convergence or divergence between the EMA.
3. The signal line or MACD SMA is a simple moving average of nine periods of the difference of the slow EMA (EMA 26) and fast (EMA 12).
MACD can be used to identify the market trend, trade disputes and to identify relative levels of overbought or oversold conditions. However, I use it mainly to confirm the direction of the trend.
As mentioned above, MACD has two areas, the upward areas (upper) and downward (lower) divided by the zero line.
Basically, when the price increases, the histogram is formed above the zero line, and this is considered as an uptrend. But when the price is falling, is formed below the zero line, which means it is in a downtrend.
The first signs of reversals outstanding prices can be seen by the relative positions of the histogram and the signal line. Since the downward or negative zone, a crossing of the signal line on the histogram is considered a possible reversal signal upward. A histogram crossing above the zero line is a bullish confirmation.
On the other hand, in the upward or positive zone, a crossing of the signal line on the histogram is considered a possible reversal signal down, and is confirmed when the histogram crosses below the zero line. Now you know how to use the MACD indicator. Happy trading ...
VIDEO-TUTORIAL
If you liked this article comments and share


0 Comments:
Post a Comment