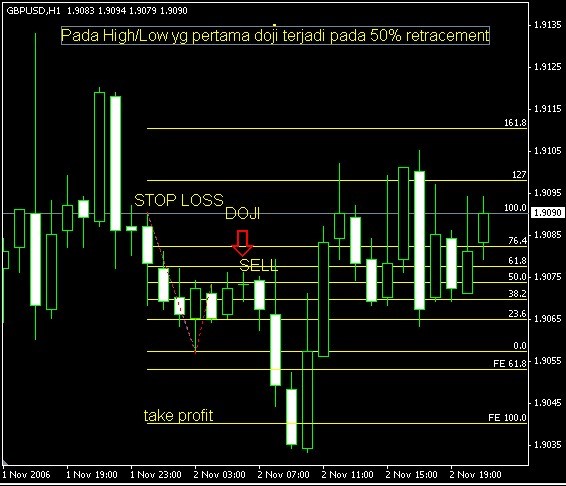
Example of use of the price action with the fibo.
Hi. I give an example of the use of fibo to confirm the sail pattern. 1. Determine the swing high and low that day. 2. Find a reversal pattern in the 50% area, if you can not find it, it means that the high and low swing have not been created perfectly. 3. After finding, confirm with the bar after. Bull or bear 4. Then take action selling or buying. (By the way, the stock is selling). 5. Put a stop loss on Swing High. 6. Create price projections using fibo expansion. Pull the high swing to the low swing. (the shape is the same as the fibo retracement). Then, install Take Profit in 100% FE for TP1 and FE 161.8% for TP2 (rarely set aside on that day). The way to open can be like this: install the same 2 positions with the same SL and 2 different TPs. When the TP1 hits and one position closes, move the SL to open the other to BEP + 1pips. So if you turn around it's still profitable 1pips on the right. (We do not know with certainty when a lateral or strong trend occurs).
HAD:
pak kenshi indicator fiboPiv_v2 on pivot line (blue line) almost determines 50% reversal pattern with having pack of kenshi22 so it might be easier to use fiboPiv_v2 determination of 50% area please correct if wrong
Kenshi22:
more or less the same ... I just gave the principle. The implementation can be determined by yourself using what indicators. Before using one indicator, you must know the purpose and purpose of making the indicator. If I just use pull the fibo line with the standard deviation. Then if you want to see the new convergence / divergence using MACD / STOCH / RSI. Don't use too much indi later confused. note: in order to determine the correct price action (reversal candle) there must be a lot of practice. Make a note on the chart. Picture there about the shape of the candlestick. continue to observe what is right the determination of the candle moves according to the estimates. If you are continuously trained, you will be sensitive by yourself, and know the shape of the candle without having to look at the notebook again.
No problem with NIQ ... I am increasingly being asked, the more I remember.
Isn't there a saying that the more you give knowledge, the more we feel. ok now back to the question.
I think there is no solution. The problem is to confirm the candle is important sich. The problem is similar to the passenger and driver. After the driver confirms the destination desired by the passenger, then it can run. If you don't confirm, then just keep playing, then in the middle of the road you can turn the direction of the dech if the aim is wrong. But it can be done by looking at a smaller chart like M15. As I said before, see BIG picture, Medium picture, and Small picture. An example can be seen in the picture. For Standard Deviation it is only for seeing trends. When prices break out of the line, there is a potential for changing trends. The trick is to just drag the line from Swing Low and Swing High. Can be seen in the picture that there are lines of 3 parallel pieces (the bottom line I extend with the help of the trendline line). Note that the price is opened below the trend, it is a confirmation of the existing signal.
Anyway I use this technique which is a simplification of the Elliot wave, which is Basic Trading 123. I will not enter the market if I don't find this pattern. The problem is besides being busy with making my comics. I'm also looking for a bigger chance to win even if it's only to get 10 or 20 pips.
2. Convergence that is if the direction of the indicator corresponds to the price movement means that the price will move slowly - following the path. Divergence that is if the direction of the indicator is not in line with the price movement (the price drops even higher) means that there is profit taking done by the trader and finally the price will return to the track in accordance with the indicator direction. All the indi is the same as MACD / STOCH / RSI, just the difference in sensitivity. MACD is very late in responding to price movements but is the best indicator as confirmation of price direction. STOCH and RSI are very quick to respond to price movements, just so fast that they often predict prices. STOCH and RSI can also be used to see overbought and oversold. (surely you already know).
For example divergence can be seen in the picture.
3. For sideways or strongtrends can be used. Because price action only estimates the movement of a few candles in the future, not the whole. Whereas to see SIDEWAY and STRONGTREND you can use the STANDARD DEVIATION line, if the angle is made large


0 Comments:
Post a Comment