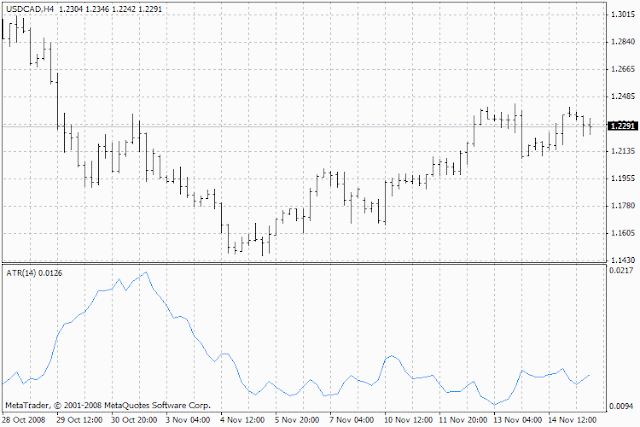
The technical indicator Average True Range (ATR) indicates in the market volatility. It was described by Welles Wilder in his book "New Concepts in Technical Operations Systems", and has since been used as a component of numerous other indicators and trading systems.
The Average True Range indicator often reaches high values on the market basis after a sharp drop in prices caused by sellers' panic. The low values of the indicator are typical for the prolonged periods of horizontal movement observed in the market peaks and in the consolidation phases. This indicator can be interpreted according to the same rules that are used for the other volatility indicators. The principle of forecasting using the Average True Range is as follows: the higher the value of the indicator, the higher the possibility of the trend change; and the lower its value, the weaker the direction of the trend.
Calculation
The True Range is the greater of the following three values:
the deference between the current maximum and minimum;
the difference between the previous closing price and the current maximum;
the difference between the previous closing price and the current minimum.
The Average True Range (ATR) is the moving average of the True Range values.


0 Comments:
Post a Comment