Next we will explain in detail a trend-tracking trading strategy which makes use of simple concepts and that most have heard on multiple occasions. This system is based on a simple and concrete theory and in a single implementation – A winning combination that should be the main feature of any good trading system.
The system does not use complex technical indicators or several tools that end up reloading a graphic and make it difficult to read as other systems, which although capable of producing good results, are not the most suitable for beginner traders. The only real care that is required is in the drawing of the trendlines as we will see later.
As always, it is recommended to test this system in a demo account before using it to operate with real money in a live account.
System settings
Recommended currency pairs: can be used in any currency pair as well as in other markets, such as metals prices and indices.
Recommended time frames: the most appropriate time frames for this strategy are 30 minutes, 1 hour, 4 hours and 1 day.
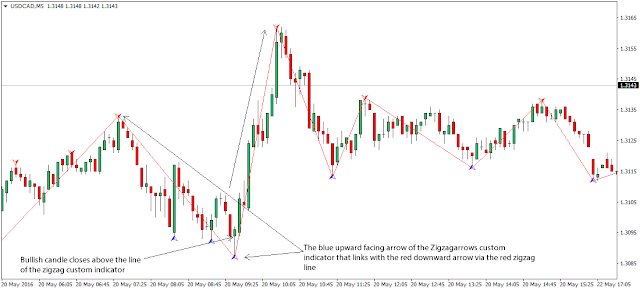
Technical indicators: Only a modified indicator for Metatrader 4 called SwingZZ (the ZZ is zigzag) is used which can be downloaded free of charge on the Internet. This indicator is useful because it allows to identify previous maximums and minimums of the price movements, which act as levels of support and resistance, making it a useful tool for this strategy.
You can download the indicator at the following link:
The trendlines used in the strategy are plotted using the maximums and lows determined by the SwingZZ indicator.
System rules
Sales positions
Identify the general trend in the time frame we are going to operate. First we must have an overview of the market that gives us a guide on what it can do in the long term. For example, when we are going to operate in the 1-hour time frame, it is recommended to analyze the daily time frame and also the 4-hour graph to visualize an obvious trend, a channel, or a congestion zone in these top time frames. In this way, if there is a congestion, for example, we keep out of the market until a breakdown occurs and a trend is established. Using the SwingZZ, you draw trendlines in the daily time frame and/or 4 hours and then change to the 1-hour time frame. In the time frame we are going to operate we also identify trend lines and mark them.
We place a sell stop, at least 5 pips below the minimum of the candle that touches or intersects the bearish trend line. The trend line may be the trend in the time frame D1, H4 or H1.
The order is placed when the Candele closes.
Note that we should wait aque the price approaches the trend line or quite close to this before placing the sell stop order.
A stop loss is placed at least 5 pips above the most recent oscillation maximum. The stop loss should be used in accordance with the monetary management practices of each trader and its risk tolerance.
The Obtjetivo is placed just within the minimum oscillation level.
Operation Management: If the operation moves in favor of the trader, it can move its stop loss up to 5 pips above each subsequent lower price peak (higher lower).
Buying positions
For purchase positions only the rules described for the sales positions are reversed:
Identify the general trend in the time frame you want to operate.
Place a Buy Stop 5 pips above the maximum of the candle that reaches or intersects the trend line. The order is placed when the candle closes.
Put a stop loss just below the most recent minimum.
The Obtjetivo takes place just within the previous maximum level.
Operation Management: If the operation moves in favor of the trader, it can move its stop loss up to 5 pips below each subsequent higher lower price (higher bass).
Sales Operation Example

The above image shows a 4 hour graph of the USD/JPY currency pair, in which we can see sales operations that we could have done using this strategy, and that may have been quite profitable.
First we see the lines of trend bearish (red lines) that connect the lowest high indicated by the Swing ZZ. Since the general trend is bearish, we must look for sales opportunities.
The yellow horizontal lines indicate the points where you can place sell Stop at least 5 pips below the closing of the candle that intersects the trend line.
We can notice how the target prices for the operations are placed near the previous price lows.
The price has tried to break the bearish trend line on several occasions but has not succeeded.


0 Comments:
Post a Comment