When starting yourself in binary options, you definitely want some strategy to trade by. Of course, you can jump into a live account and press Call/Put button listening to your intuition but that will not end up well for your financial prosperity.
This is a review of one of the strategies that can be freely used by any binary options trader. You will learn the strategy’s rules, get to know its advantages and find out how to avoid its main cons.
Before proceeding to the review of the 60 Seconds Trading Strategy, it is necessary to explain the strategy itself in details. And before doing that, it will not hurt to remind you of what “60 Seconds” option really is.
Here we go:
60 Seconds Option
60 Seconds is a special type of binary options where the outcome of a trade is determined within one minute time. If you have chosen Call and the underlying asset (currency pair or stock, or whatever) finished above the entry level, you win. If you have chosen Put and the underlying asset finished below the entry level, you also win. In other cases, you lose. It is really that simple.
Strategy
Although there are many strategies for trading 60 seconds options — complex, simple, technical, fundamental, genial or simply absurd, there is one strategy that is mentioned in several other binary options websites. This system is often called just 60 Seconds Binary Options Strategy and is usually given out for free. It is frequently described in connection with TradeRush trading account, though it is not a requirement as the strategy can be used with any other broker featuring “Option Popularity” indicator for its binary options (nearly all brokers with SpotOption platform have that.)
Step-by-Step
There are several variations of the 60 Seconds Binary Options Strategy, but usually it consists of only three simple steps:
Step 1
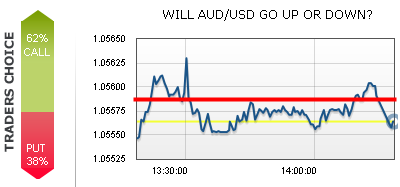
Find the underlying asset (a Forex pair or some commodity, or any other trading instrument), which is trading well above the middle of the chart or well below it. See example:
Step 2
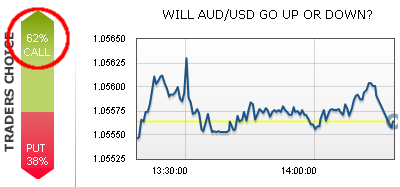
Check the popularity indicator for this asset. It shows how many binary traders at this particular broker are choosing Put/Down or Call/Up for this option. If the asset is trading above the middle of the chart (see Step 1), popularity of Put should be higher than popularity of Call (more than 50%). If the asset is trading below the middle, popularity of Call needs to be higher than popularity of Put. See example:
Step 3
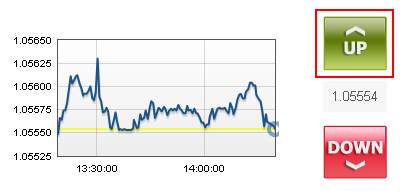
If both conditions are fulfilled, it is now time to assume a position. Remember, you choose Call only when the majority of traders is “calling” and you chose Put only when the majority is “putting.” If at least one of the conditions is not met, proceed to Step 1. In our example, we ought to choose Up (Call) for AUD/USD as both conditions apply:
Some More Examples
To understand how the system works, here are some more examples.
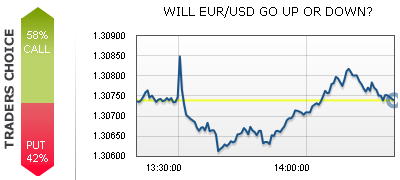
Bad. This EUR/USD example from GTOptions would fail on Step 1 as it is trading near the middle of the chart:
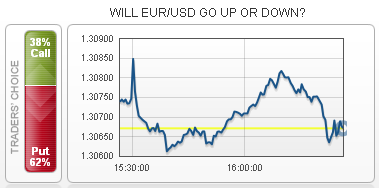
Bad. This EUR/USD example from DragonOptions fails at Step 2. While the first condition is fulfilled (the currency pair is trading quite below the chart’s middle line), the Put/Call ratio is not showing in our favor:
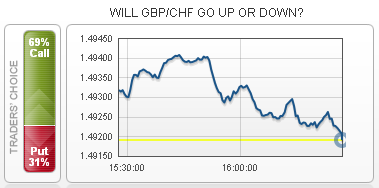
Good. This GBP/CHF example from DragonOptions is a perfect fit for the strategy’s conditions. It is trading far down below the chart’s middle and the Call popularity exceeds Put popularity by 38%:
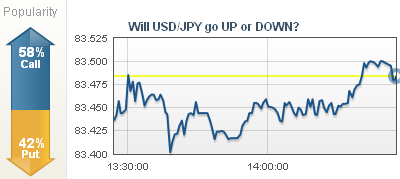
Bad. This USD/JPY example from TradeRush is showing another mismatch — the pair is trading above the middle line, while the traders are predominantly choosing Call:
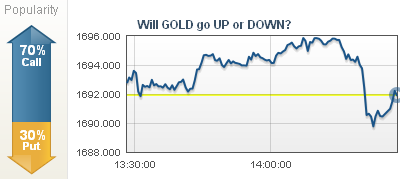
Bad. While there is a nice 40% difference in favor of Call popularity for Gold in this example from TradeRush broker, the metal itself is trading right at the middle of the chart and thus cannot be traded using 60 Seconds Binary Options Strategy:
Variants
While the steps described above may certainly be called canonical for the 60 Seconds Binary Options Strategy, there are many variants. Some are quite similar, while others are completely different.
The former ones only add or remove one step or alter money management rules. For example, they may omit the first step (disregard the relation of the current price to the chart’s average line) but add Martingale position sizing instead.
The latter ones may add steps to check like 3–5 technical indicators more on a third-party trading platform. For example, they may call for signal confirmation by MACD, Stochastic Oscillator and Parabolic SAR on MetaTrader 4chart for the traded asset. In any case, these heavily modified 60 seconds strategies are beyond the scope of this review, as they are very different from what is explained in the Step-by-Step section here.
Why It Can Work
While there is some potential in this strategy, the websites boasting “87% chance of winning” or something similar simply do not know what they are talking about. There are four noteworthy improvements this system has over random or “blind” trading.
Overbought/Oversold
By choosing only charts where the asset is trading significantly above or below the middle line we trade Calls only on oversold instruments and trade Puts only on overbought ones. Basically, what such chart disposition means is that the asset is trading well below or well above its average value for the last hour (that is the period those charts show). Buying something that is oversold and selling something that is overbought can be a good idea and is a basis for some popular Forex and stock trading strategies. That is until you get into some strong rally that way…
Sentiment Measure
By choosing only direction, which is currently prevailing among other traders, we go with the crowd in this strategy. Trading with the crowd is often considered lame and counter-productive , but since the position is lasting only 60 seconds with this BO strategy, we just make sure to go with the trend by gauging the current market sentiment.
Combo
Many traders try to create complex strategies combining multiple technical indicators, forgetting that some indicators are based on the same data set and combining them only reduces the amount of signals, while keeping their quality at the same low level. This 60 seconds BO strategy is doing it the right way — it combines technical indicator (chart average vs. current price) and sentiment indicator (Call/Put popularity). Although, these parameters are somewhat connected, they possess a satisfactory level of independence to be used together in a system.
Systematic Approach
What many newbie traders lack when they approach something as simple as binary options is a system. They trade almost randomly — buying (Call) and selling (Put) just by intuition. This lack of any system may lead to excess losses, overtrading, emotional instability and eventual disappointment in binary trading. Using a system, trader gets a set of rules to act upon, leaving a lot less space for errors, emotional trading and pure gambling. A systematic approach even with a subprime strategy may lead to brilliant results as it works miracles for trading discipline.
Why It May Fail
While it certainly has its advantages, the 60 Seconds Binary Options Strategy is not as good as some marketing gurus make it look to be. You should be aware of this strategy’s potential problems and real dangers. There are three important disadvantages to it.
Lack of Statistical Evidence
There is no statistical data that would prove this strategy’s long-term or even short-term profitability. While some websites show screenshots of statements full of winning trades, they are hardly proof to anything. The difficulty with this 60 seconds option strategy is that it is extremely hard to automate and backtest. And since binary brokers rarely provide demo accounts (at least for long period of time), you would have to risk your real money for potential gains.
Popularity Inconsistence
The popularity indicator is a great tool for measuring market sentiment for a given underlying asset. Unfortunately, it is not consistent between different brokers. It may show one value on one broker and at the same time show a different value on another broker. The readings may even contradict each other completely. See the screenshot of the AUD/USD popularity index at TradeRush:
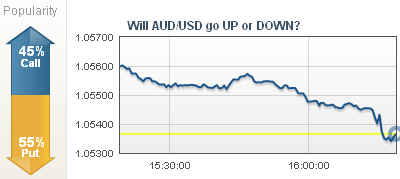
And see the screenshot of the same pair taken almost simultaneously at GTOptions:
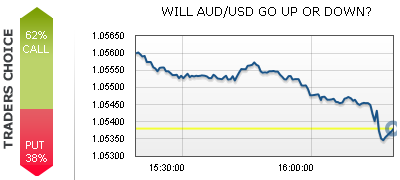
Evidently, the first chart shows Call popularity of 45% vs. Put popularity of 55%, while the second chart shows a strikingly different ratio of 62% vs. 38%. It is quite obvious that those two charts would generate totally different trading signals. In this case, GTOptions‘ chart would generate a Call signal, while TradeRush‘s chart would give no signal at all as the popularity index contradicts the current price position.
The source of the inconsistencies is in the fact that brokers know only their own traders’ positions and have no knowledge of the situation in the market as a whole. Additionally, some brokers may display completely random values for popularity indicator or even manipulate it to drive traders into some convenient (for broker, not for traders) direction.
Low Yield
The majority of brokers offer 70% yield on 60 Seconds binary options. Although 70% may sound a lot for a 60 second gain, it is not a lot compared to a potential loss of 100% within the same 60 seconds. According to our Broker’s Edge Calculator, 70% payout with no out-of-money reward results in 15% average loss per trade. This means that if you win at the same rate as you lose, you will be losing $1.5 on every $10 trade with 60 Seconds options.
To overcome the intrinsic losing predisposition of this option type, you would need to win at least 59% of your trades. It is a significant edge and even it would lead only to breakeven trading. You would require a better edge to earn consistently with 60 Seconds options. Whether the 60 Seconds Binary Options Strategy is able to provide the winning rate of 60%/40% is a million dollar question. Unfortunately, you would need to risk your hard-earned money to find out.
Tips and Recommendations
Although the strategy is in and of itself pretty instructive and with clearly defined rules, your experience with it may be improved significantly by knowing some of the accompanying nuances and applying some minor tweaks.
- Find a broker that gives higher payout than 70% on 60 Seconds binaries. For example, GTOptions offers 75% on 60 Seconds for some currency pairs and commodities. The rates may vary depending on market conditions, so check other brokers too. Shop for best offers!
- Do not forget that you may use price chart and popularity indicator from one broker to generate your trading signals and enter the actual trade with another broker. This can be very convenient if your main binary broker does not offer some of the tools required for the 60 Seconds Binary Options Strategy.
- Keep your positions small relatively to your total investment amount. Do not risk more than 1% or 2% of your capital on one trade. For example, if your deposit (which you can afford to lose) is $1,000, do not trade with option size bigger than $15-$20.
- Do not double up your stake on losses. It is a sure way to lose all your money.
- Be aware of your broker’s trading schedule — not all brokers offer 60 Seconds options during normal trading hours.
- Keep an eye on the trend strength. If the underlying asset is trending strongly, this strategy will produce to many bad signals. Just avoid trading this instrument for some time if you spot a stubborn rally or correction.
- You will get a lot of trading signals with this strategy, especially if you trade with several brokers and with many instruments. Do not lose your head in trading, keep calm and stop trading for some time if you start making mechanical errors.
- Try to keep a trading log. You will not be able to log every trade in
real-time mode, but in the end of the day, open your account’s closed positions and write everything down, pointing out the “weak signal” trades, positions entered by mistake or any other peculiarities; calculate your win/loss ratio for the day and overall. Revise your approach to trading if you start making net losses for several days in a row.


0 Comments:
Post a Comment